What power alone can't tell you
A cyclist's power surged 26 watts in five weeks. Expression dropped. Then offset took over, and Expression reached 84%, the highest this seat has ever scored. The number that looked like peak fitness wasn't. The peak came later, at lower power, and it took two dimensions to see it.
When power goes up, does fitness follow?
You open your season analytics and your power numbers are up. At the durations that matter most to you, you're producing more watts than you were two months ago. Your best efforts are sharper, your intervals are faster, your legs feel like they're finally responding to the work.
What do you do with that?
The conventional answer is: you got fitter, keep going. But what if the power gain came at the expense of something else moving? Something a single number per duration can't show you?
One athlete, two seats, one season
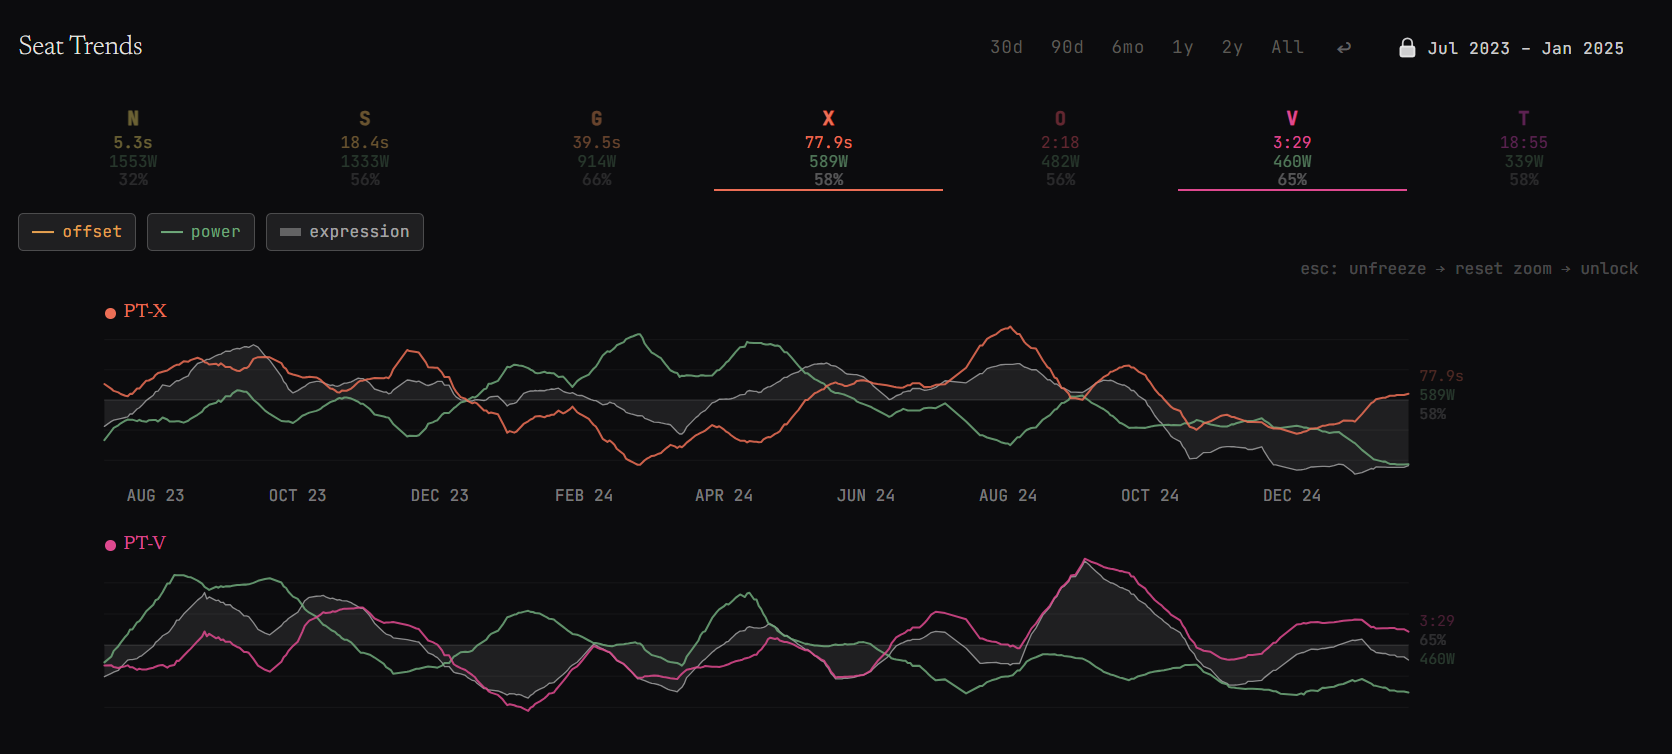
The Seat Trends page tracks each of PTA's seven seats over time in two dimensions: power and offset. We're going to focus on two adjacent seats across one season of racing and training.
PT-X is in the maximal-capacity range. For this athlete, it currently falls near 78 seconds. This is the duration range associated with hard accelerations, short climbs, and race-finishing efforts.
PT-V is in the VO2max range. For this athlete, it currently falls near 3:29. This is the duration range associated with sustained high-intensity efforts: long climbs, breakaway pace, the kind of riding that separates finishers from the field.
These two seats are near each other in duration. What happens at one can reshape what's possible at the other.
Power went up. Expression went down.
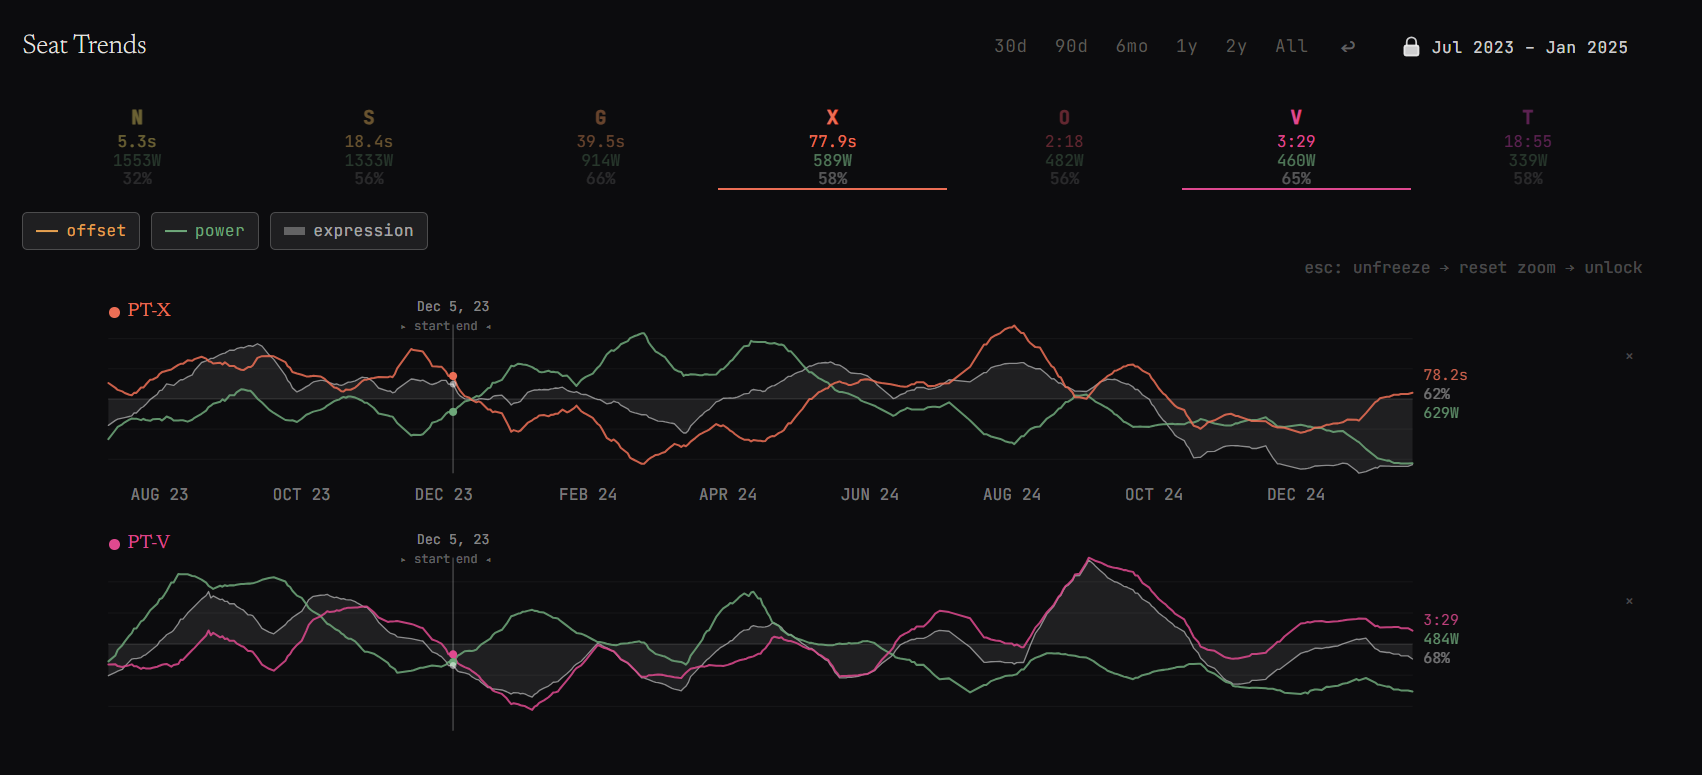
In early December 2023, this athlete's PT-V was 3:29 offset and 484 watts, with an Expression of 68%.
Expression measures how fully a seat is being realized relative to the athlete's own historical peaks. It is the product of two ratios: how close the current offset is to its all-time peak, and how close the current power is to its all-time peak. At 68%, the athlete was expressing roughly two-thirds of what this seat has demonstrated it can do.
Then power started climbing.
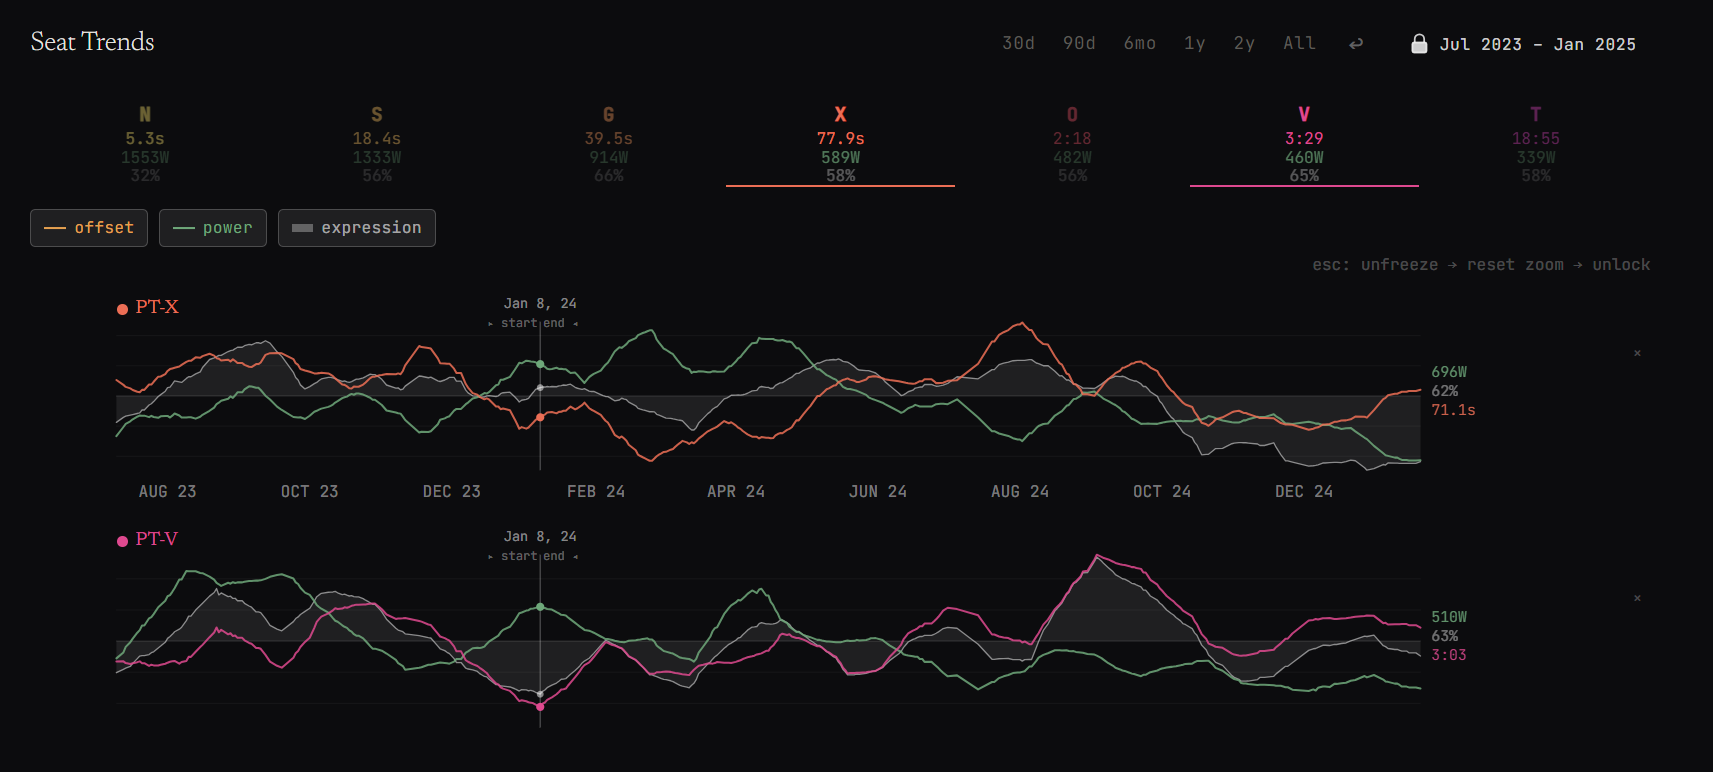
By January 2024, PT-V power had surged to 510 watts. That is a gain of 26 watts in about five weeks. On any conventional dashboard, this looks like a breakthrough. Faster intervals, bigger numbers, clear progress.
But the offset contracted. It dropped from 3:29 to 3:03, narrowing the seat by 26 seconds. And Expression fell from 68% to 63%.
Read that again. Power went up. Expression went down. Both things happened at the same time because the power gain was more than offset by the contraction in duration range. The seat got stronger in one dimension and smaller in the other, and the net realization of the athlete's capacity actually declined.
A power-only lens never shows you this. It shows a 26-watt gain and calls it progress.
Power pushes. Offset absorbs. The seat expands.
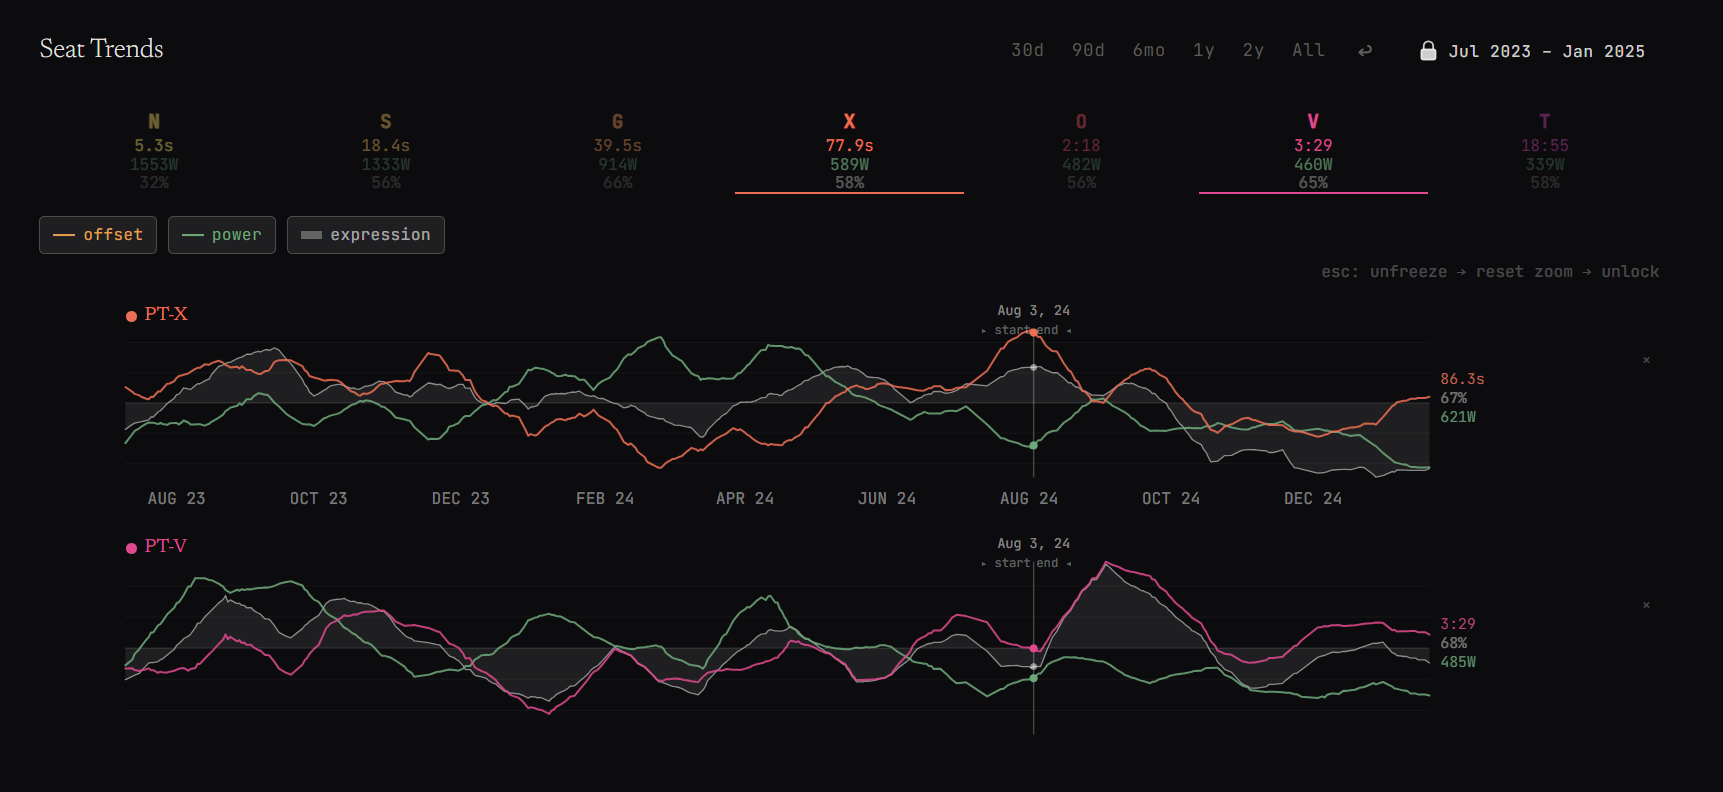
What happened next is where the Seat Trends page earns its name. After the January power peak, the pattern reversed. Offset started expanding. Power gave back some of its gains. Then power pushed again. Then offset expanded further.
In the PT-X chart above PT-V, the same rhythm is visible. PT-X Expression rises first. The athlete builds capacity at the shorter duration. Then PT-V Expression follows, as the longer-duration system appears to extend into the capacity that PT-X built. They don't move together. They oscillate. When one rises, the other tends to give ground.
This isn't perfectly clean. Training doesn't produce tidy sine waves. But the pattern repeats through the winter and spring of 2024, and each cycle leaves both seats slightly wider than they were before. Power pushes, offset absorbs, the seat expands.
Over several of these cycles, a shift happens. Offset stops giving back its gains between cycles. It starts holding. Then it becomes the dominant mover, expanding faster than power is declining. The seat is getting structurally wider, not just temporarily stronger.
84%. The highest Expression this seat has ever scored.
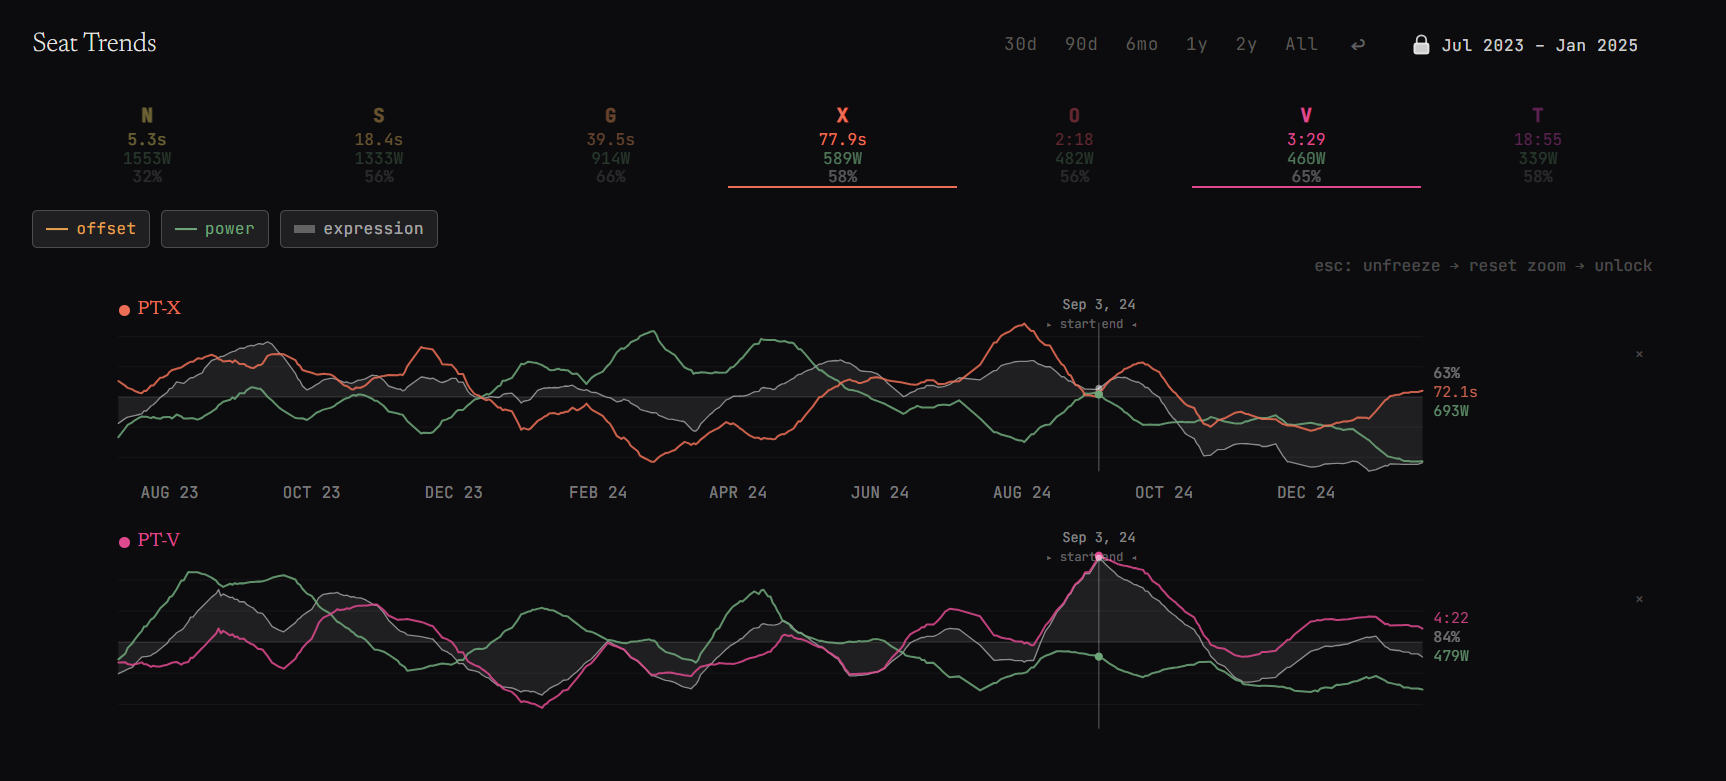
In September 2024, PT-V Expression reached 84%.
That number is higher than anything this seat scored when power was 510 watts.
At this point, PT-V was 4:22 offset and 479 watts. Power was 31 watts lower than the January peak. Offset was 79 seconds wider. And the product of both ratios, the combined realization of what this seat can do, produced the highest Expression score in the athlete's recorded history at PT-V.
This is what the ten-month arc was building toward. The offset expansion wasn't a symptom of declining power. It was the structural change that made a new ceiling possible. Each power-then-offset cycle built a slightly wider foundation, until the seat's duration range had expanded enough that even with less peak power, the athlete was realizing more of their VO2max capacity than they ever had at higher wattage.
The training target moved
The practical consequence is immediate. In December 2023, this athlete's PT-V was 3:29. A coach looking at that data would reasonably target VO2max intervals in the 3:00 to 3:30 range. That was where the seat lived.
By September 2024, PT-V had moved to 4:22. A coach seeing this data might shift efforts to the 4:00 to 4:30 range, the duration where the expanded seat now lives. Training where the seat used to be means the training target is stale.
That's the kind of decision that changes with better information. Not "keep pushing watts." Not "your power dropped from the January peak, fix it." Instead: the system reorganized, the seat expanded past where it started, and the place where focused effort pays off moved with it.
Your data
This is one athlete's data across 222 sessions over ten months. The power-then-offset cycle and the PT-X / PT-V interplay are patterns observed in this timeline. They may appear in yours, or your seats may show different relationships, different pairings, different adaptation sequences entirely.
The point is not that this specific pattern is universal. The point is that the Seat Trends page makes these patterns visible for the first time. Power alone would have told this athlete that January was the peak and everything after was regression. Two dimensions told a different story, one where the real peak came eight months later, at lower power, in a configuration that power alone would never have identified.
Open your Trends page. Pick two adjacent seats. Watch how they move relative to each other. You might find something worth changing your training for.